Principles of the Hoffmann method
The Hoffmann method1 can separate out Gaussian distributions from data sets that also contain values from non-Gaussian populations. This is helpful for establishing indirect reference intervals because, for many analytes, results from healthy individuals follow a Gaussian distribution. The method may also be used for non-Gaussian analytes, a data transformation just needs to be applied first.
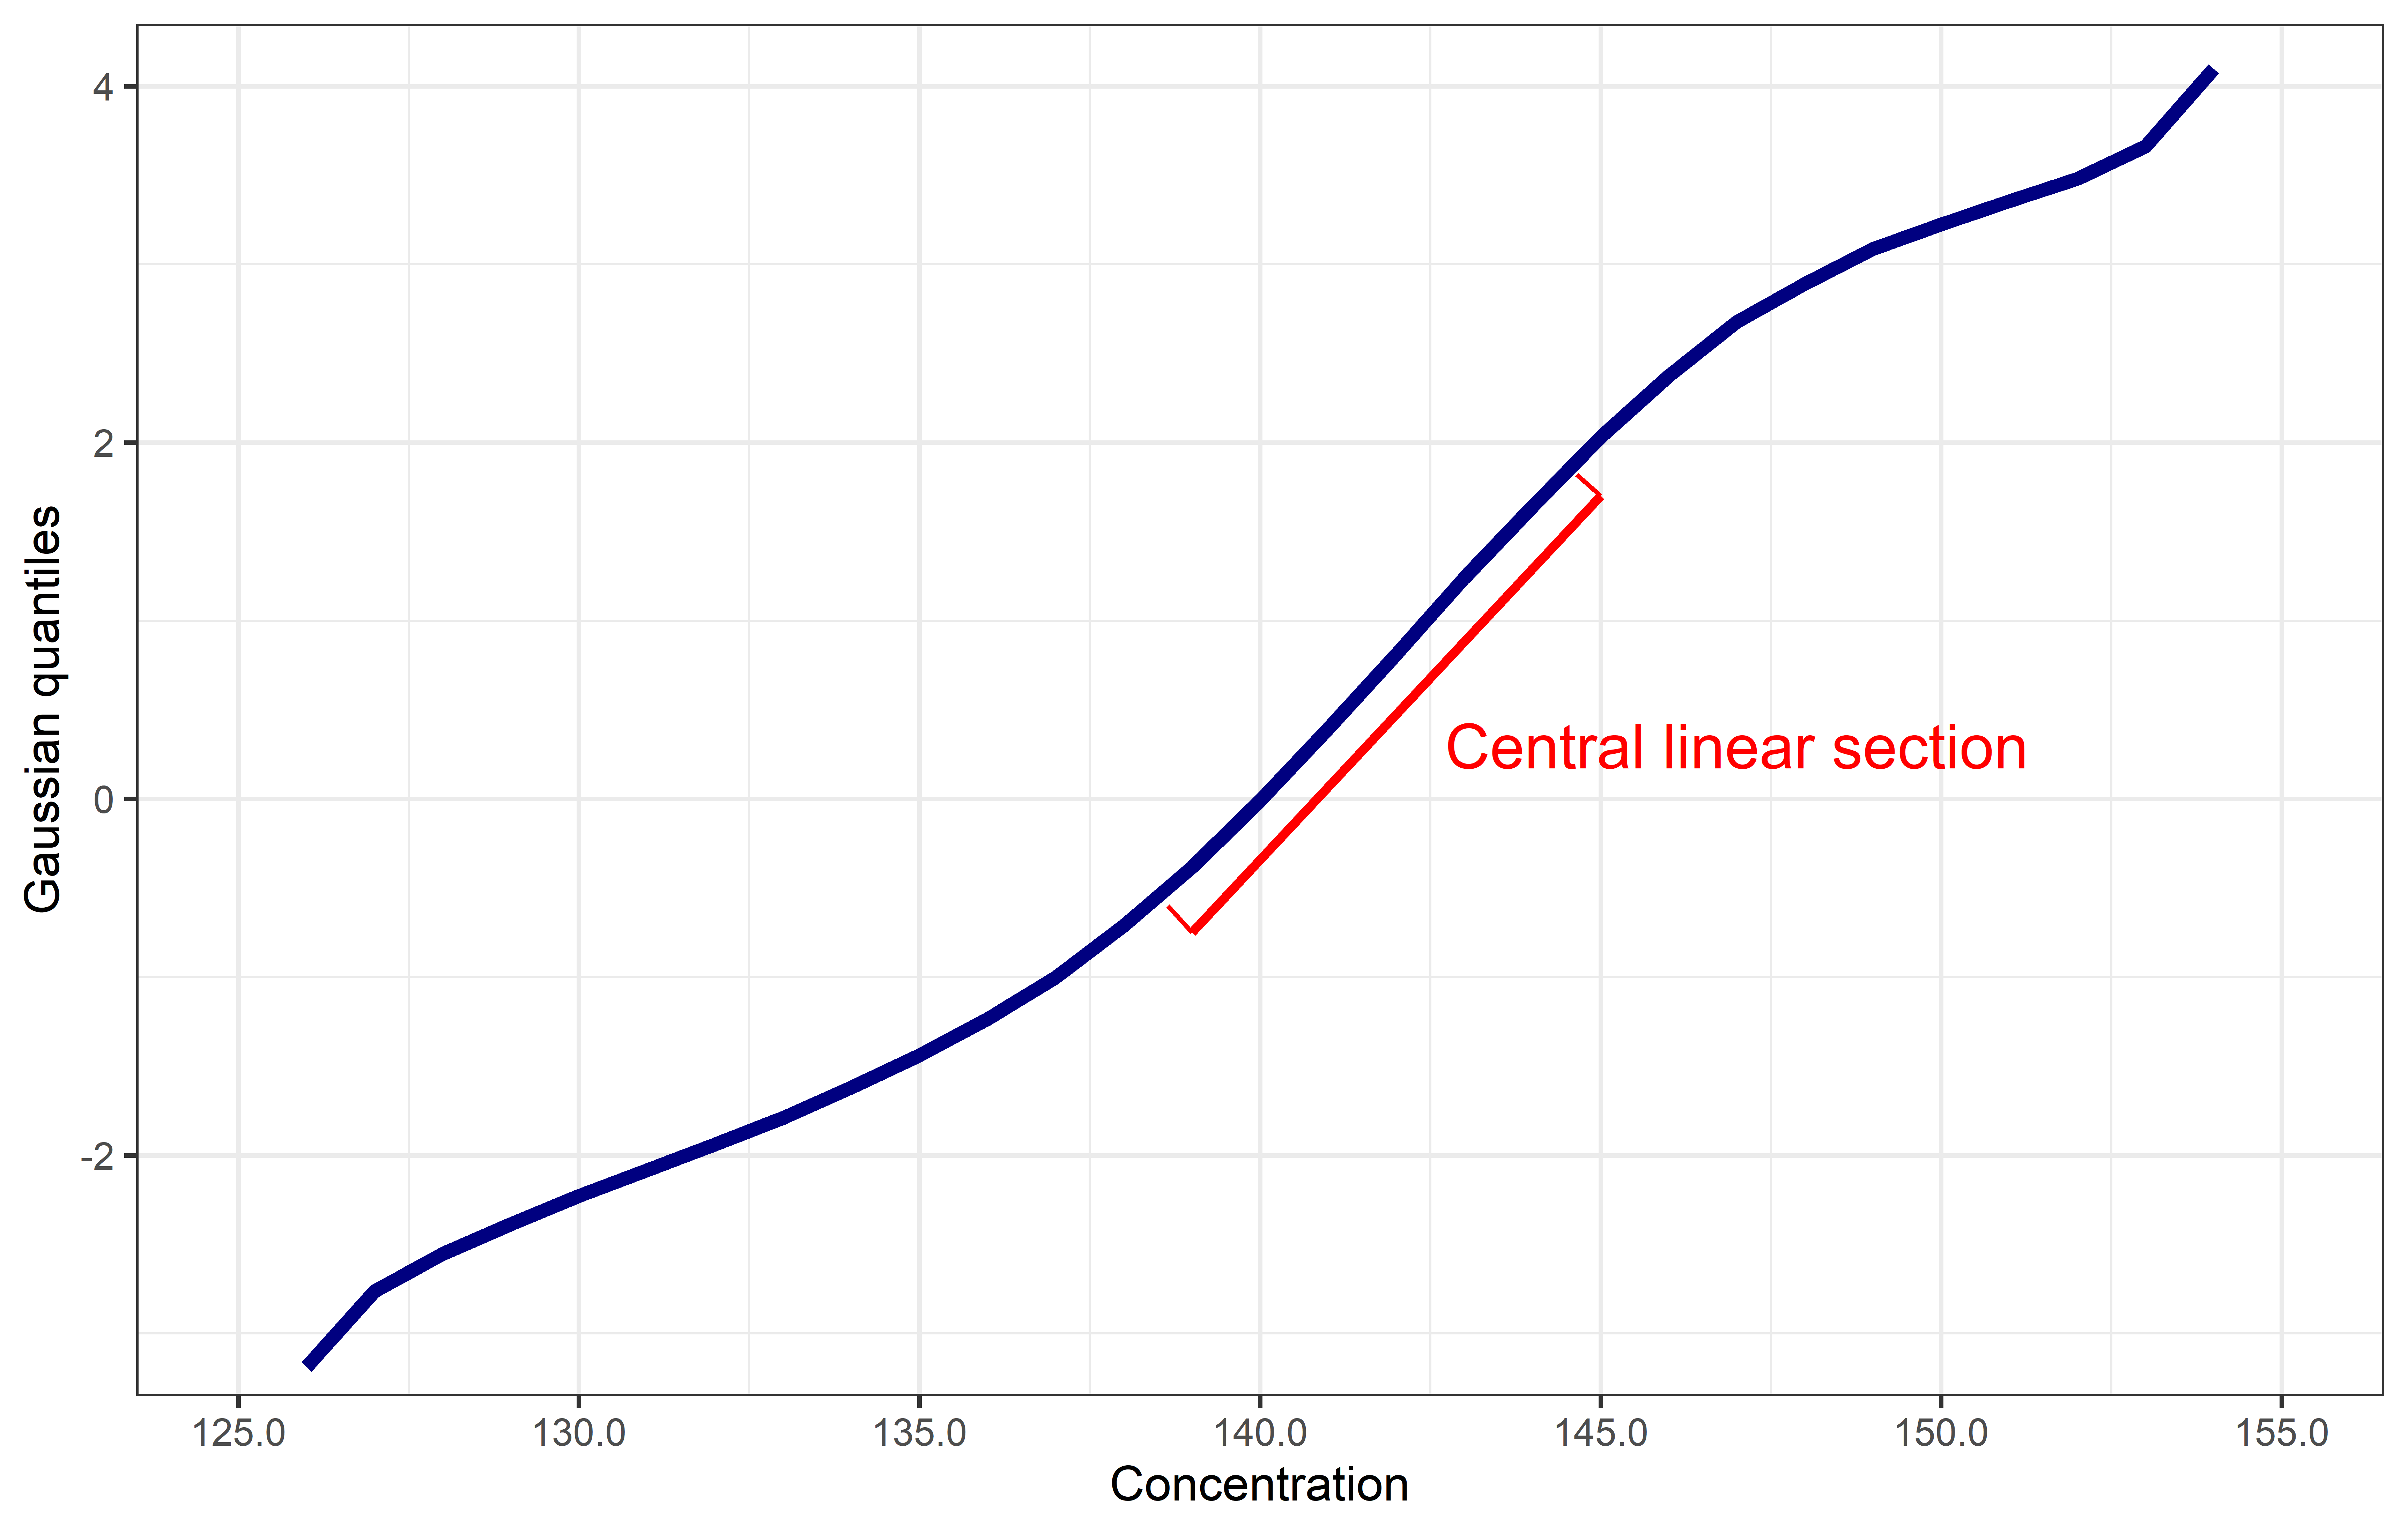
The Hoffmann method involves plotting cumulative frequency. If plotted in the normal manner, the cumulative frequency of a Gaussian distribution will have a sigmoidal shape. In the Hoffmann method, however, the cumulative frequency is plotted against quantiles of the standard Gaussian distribution or, equivalently, using Gaussian probability scale for the y-axis. Plotted in this way, Gaussian components in the data will appear as straight-line sections (Figure 1).
 |
|---|
| Figure 1. Sodium data plotted against standard Gaussian quantiles. The linear component in the centre of the graph represents the Gaussian distribution of healthy subjects. |
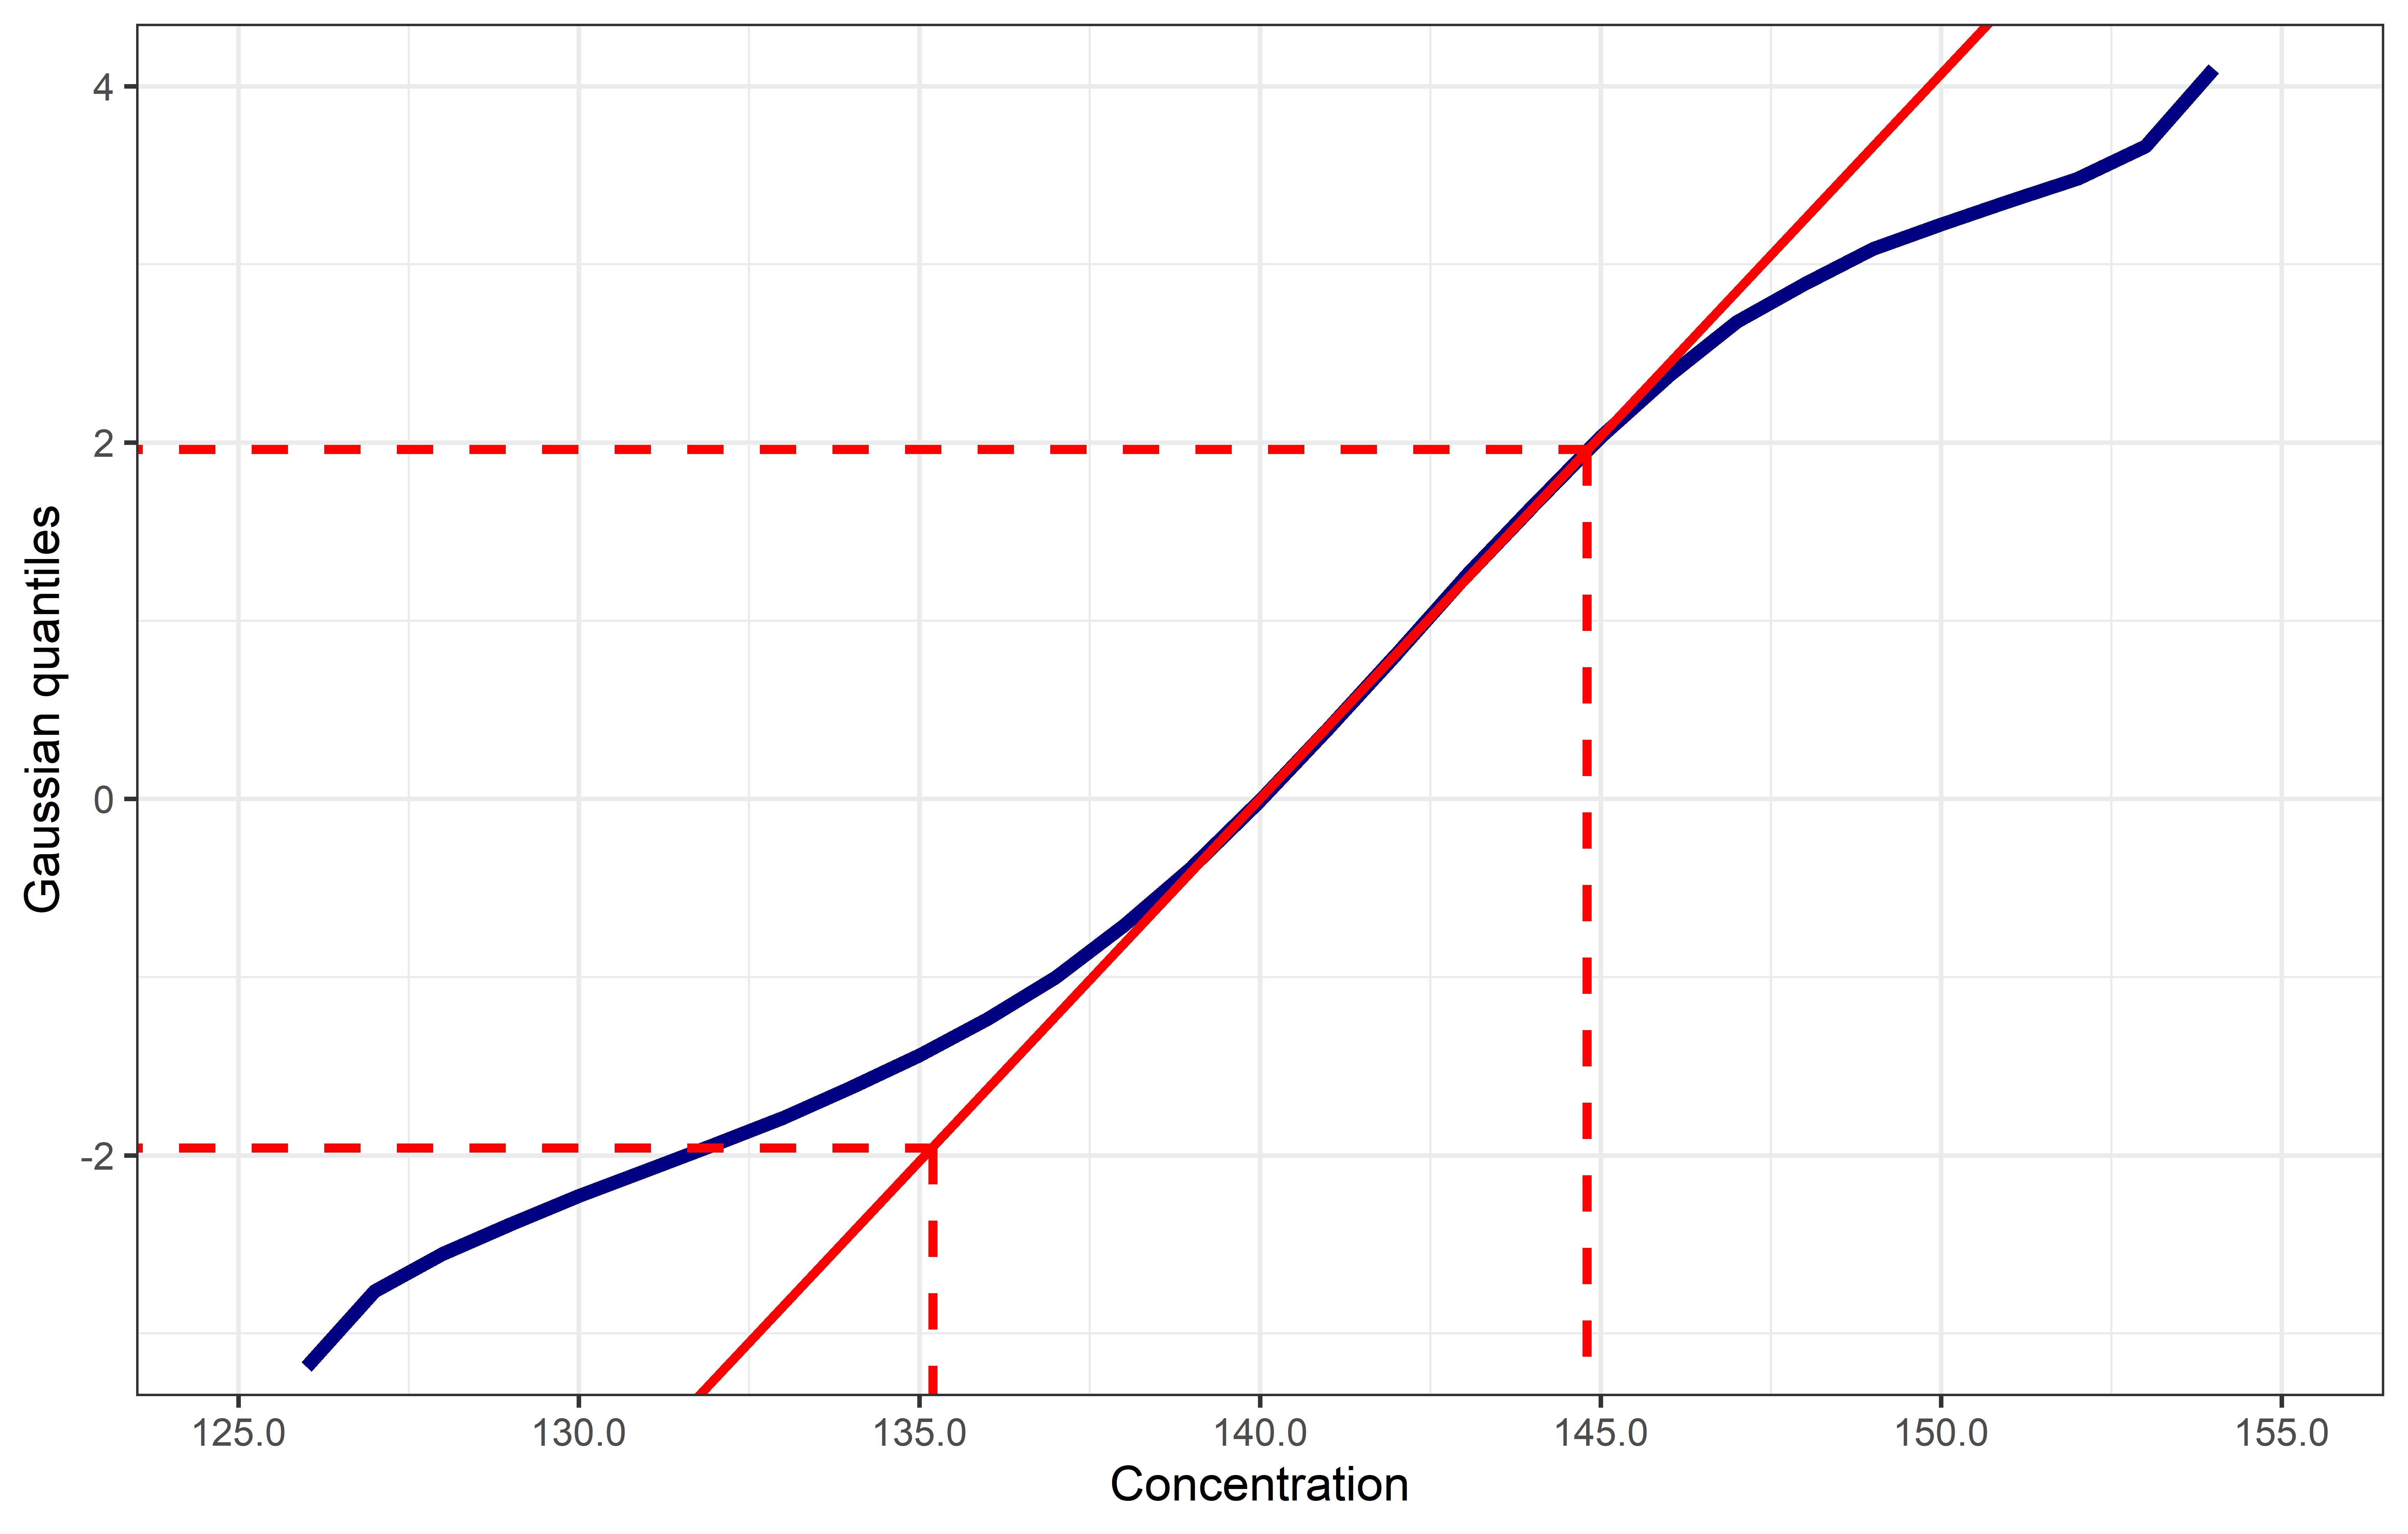
The analyst using the Hoffmann method needs to identify the straight-line component of the plot. A line of best fit is drawn through this part of the curve, with greatest weight given to fitting the region around the mean (y-value of zero). The x-values at the points of the line where y = -1.96 and y = +1.96 are the lower and upper reference limits (Figure 2).
 |
|---|
| Figure 2. Hoffmann plot for deriving reference limits. Linear regression is performed on the data forming the straight line component of the plot. The x-values of the regression where y = -1.96 and y = +1.96 are the reference limits. |
HoffApp generates the ‘Hoffmann plot’ and performs all steps automatically once the analyst has selected the straight-line component of the plot. Details on the use of HoffApp are available here.
A variation of the Hoffmann method, in which cumulative frequency plotted using a linear scale, has been used by some groups2,3 but is controversial4,5 and is not used by HoffApp.
The standard Hoffmann method has been used in published indirect reference interval studies6,7 and the method is discussed by the IFCC Committee on Reference Intervals and Decision Limits.8
References
- Hoffmann RG. Statistics in the practice of medicine. JAMA 1963; 185: 864–73. PubMed
- Katayev A, Fleming JK, Luo D, et al. Reference intervals data mining: no longer a probability paper method. Am J Clin Pathol 2015; 143: 134-42. PubMed
- Feng Y, Bian W, Mu C, et al. Establish and verify TSH reference intervals using optimized statistical method by analyzing laboratory-stored data. J Endocrinol Invest 2014; 37: 277-84. PubMed
- Jones G, Horowitz G. Reference intervals data mining: getting the right paper. Am J Clin Pathol 2015; 144: 526-7. PubMed
- Holmes DT, Buhr KA. Widespread incorrect implementation of the Hoffmann method, the correct approach, and modern alternatives. Am J Clin Pathol 2019; 151: 328-35. PubMed
- Søeby K, Jensen PB, Werge T, Sørensen S. Mining of hospital laboratory information systems: a model study defining age- and gender-specific reference intervals and trajectories for plasma creatinine in a pediatric population. Clin Chem Lab Med 2015; 53: 1621-30. PubMed
- Płaczkowska S, Terpińska M, Piwowar A. Establishing laboratory-specific reference intervals for TSH and FT4 by use of the indirect Hoffmann method. PLoS One 2022; 17: e0261715. PubMed
- Jones GR, Haeckel R, Loh TP, et al. IFCC Committee on Reference Intervals and Decision Limits. Indirect methods for reference interval determination - review and recommendations. Clin Chem Lab Med 2018; 57: 20–9. PubMed
