Principles of Bhattacharya Analysis
Bhattacharya analysis1 separates out Gaussian distributions from data sets which also contain values from non-Gaussian populations (or multiple Gaussian populations). This is useful for establishing indirect reference intervals because, for many analytes, results from healthy individuals follow a Gaussian distribution. Bhattacharya analysis can also be used if results follow a non-Gaussian distribution. For these analytes, a data transformation is applied prior to analysis.
Bhattacharya analysis works graphically. It uses a calculation to ‘straighten’ Gaussian distributions, so that they appear as straight-line segments (with downward slope) when plotted on a ‘Bhattagram’. This allows them to be easily identified (Figure 1).
 |
|---|
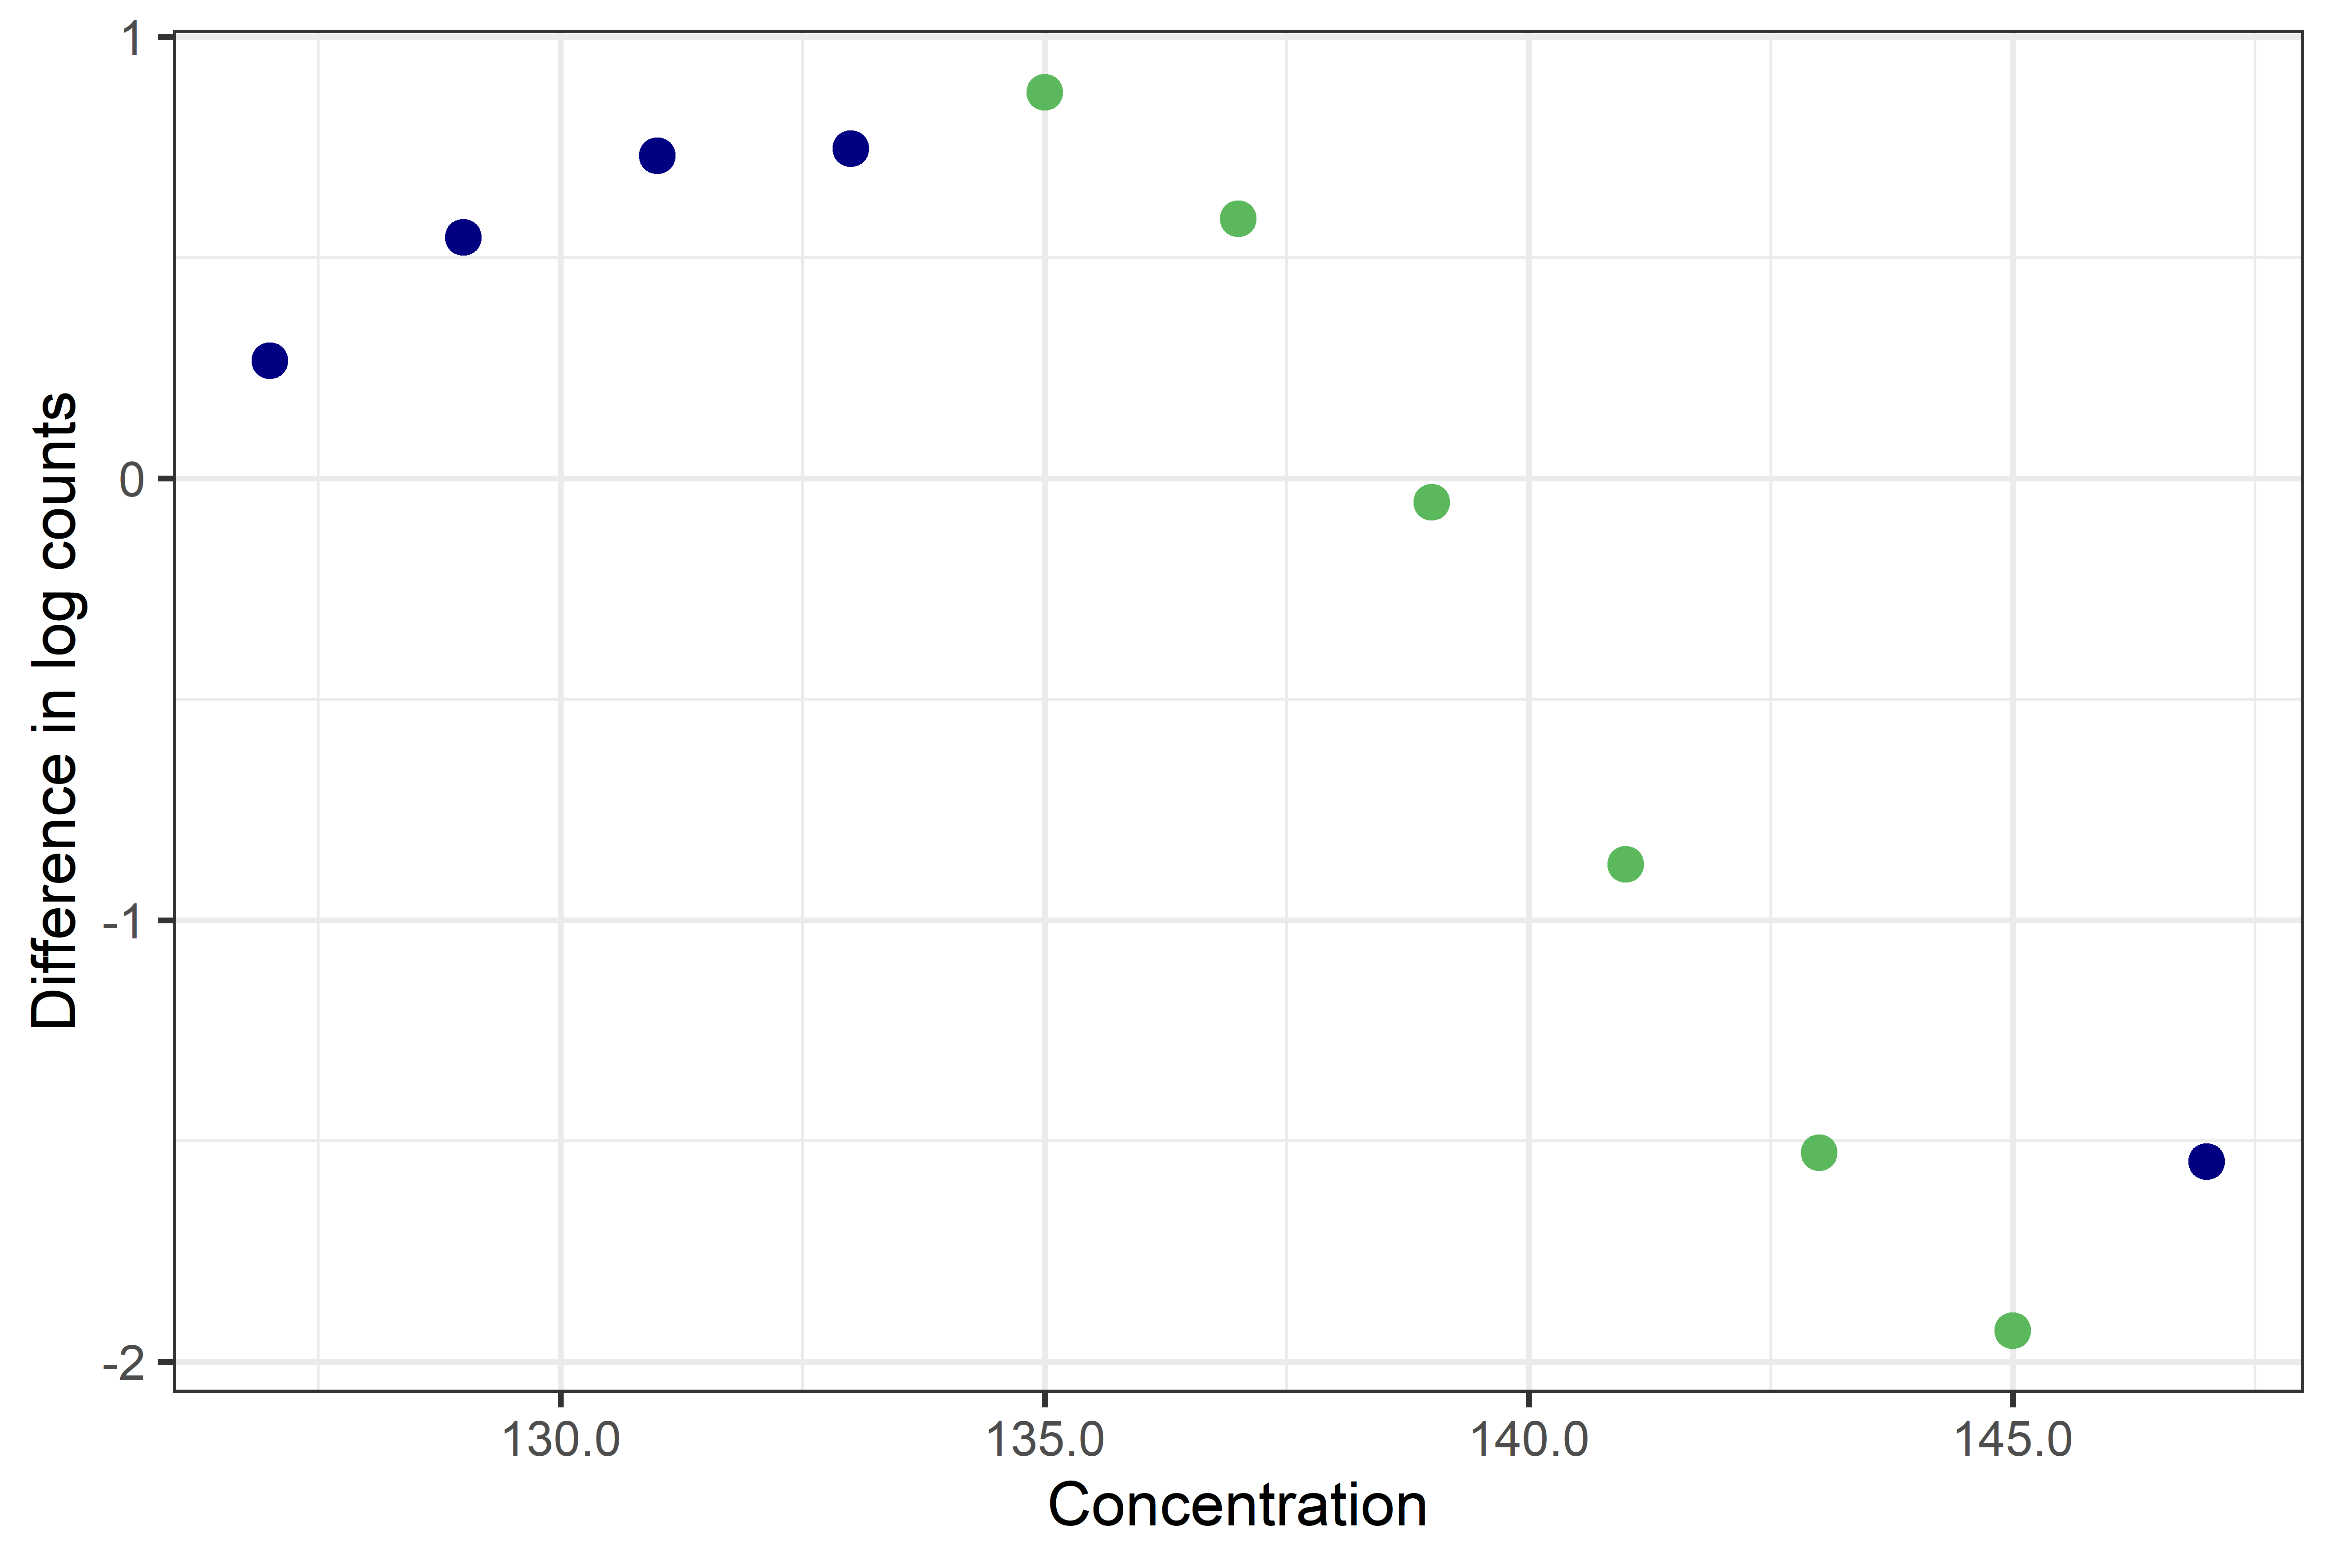
| Figure 1. Bhattagram for a set of sodium results. The linear points representing the Gaussian portion are shown in green. |
Bhattagrams have the same x-axis as histograms: data is grouped into discrete ‘bins’ (separate intervals of equal length, h) and the bin midpoints plotted. On the y-axis the results of the straightening calculation are plotted: the logarithm of the frequency of observations in each bin is subtracted from the logarithm of the frequency of observations in the next bin along. Expressed mathematically, this is:
$$log_e\{y(x + h)\} - log_e\{y(x)\}$$
Where y(x) is the frequency of bin x
This calculation works to straighten Gaussian distributions because it converts the theoretical Gaussian distribution into the form ax + b, i.e. a straight line. A full derivation is provided in the original paper.1 A more approachable overview of how the maths works is also available.2
The person performing Bhattacharya analysis doesn’t need to know the mathematical details, however. All they need to do is identify the straight-line points on the Bhattagram. The mean and standard deviation of the Gaussian distribution represented by these points can be calculated from the slope and intercept of the line of best fit through them. The reference interval can then be easily calculated.
BhattApp performs all these calculations automatically once the analyst has selected the straight-line points. Details on using BhattApp are available here.
Bhattacharya analys is has been used in published indirect reference interval studies3 and the IFCC Committee on Reference Intervals and Decision Limits has discussed its use.4
References
- Bhattacharya CG. A simple method of resolution of a distribution into gaussian components. Biometrics 1967; 23: 115–35. JSOTR
- Farrell CL, Nguyen L. Indirect reference intervals: harnessing the power of stored laboratory data. Clin Biochem Rev 2019; 40: 99-111. PubMed
- Farrell CL, Nguyen L, Carter AC. Parathyroid hormone: data mining for age-related reference intervals in adults. Clin Endocrinol (Oxf) 2018; 88: 311-17. PubMed
- Jones GR, Haeckel R, Loh TP, et al. IFCC Committee on Reference Intervals and Decision Limits. Indirect methods for reference interval determination - review and recommendations. Clin Chem Lab Med 2018; 57: 20–9. PubMed
